
KPI Library
Agency and professional services KPIs from the books up
Utilization, effective hourly rate, realization and margin per client: how service firms build each number, with healthy ranges.
The short answer
- A service firm sells hours, so its real product cost is delivery payroll. Gross margin per client is only meaningful once salaries are split between delivery and overhead.
- Utilization is billable hours divided by available hours. Sustainable full-time delivery sits at 65 to 75 percent, not 90.
- Effective hourly rate — fee divided by hours actually worked — is more useful than your rate card, because it captures scope creep and discounting in one number.
- Retainers are deferred revenue until the work is delivered. Recognizing them on receipt makes a good month look great and the following month look broken.
- Revenue per delivery employee is the fastest read on whether growth is coming from leverage or just from hiring.
Split payroll before anything else
In an agency, payroll is both cost of goods sold and overhead, and the books usually lump it into one account. Until delivery salaries are separated from sales, admin and leadership salaries, gross margin does not exist. We split payroll by role, allocate partly billable people by their tracked ratio, and keep the allocation stable so month to month comparisons mean something.
- Delivery salaries, contractor costs and delivery software are cost of revenue
- Sales, finance, admin and leadership are overhead
- Employer taxes and benefits follow the salary they belong to
- Founder time that delivers client work counts as delivery
Utilization, realization and the gap between them
Utilization asks how much of the available time was billable. Realization asks how much of that billable time was actually paid for. A team can be 80 percent utilized and still lose money if realization is 70 percent because of write-offs, over-servicing and fixed-fee overruns. Tracking both, per person and per client, is how a firm finds the account that is quietly consuming a third of the team.
Fixed fees need time data more than hourly work does
Firms that move to fixed fee or retainer pricing often stop tracking hours, which is exactly backwards. On hourly work the invoice self-corrects. On a fixed fee, hours are the only way to know whether the price was right. Time entries do not have to be billed to be tracked, and even a light weekly log is enough to produce an effective hourly rate per client.
Deferred revenue keeps the trend line honest
Annual prepayments and quarterly retainers should land in deferred revenue and release as work is delivered. Otherwise January looks like a record month, February looks like a collapse, and no trend on your dashboard can be trusted. This one change usually flattens an agency's revenue chart into something that finally resembles the business.
What LedgerDude produces for a service firm each month
Gross margin by client and by service line, utilization and realization by person, effective hourly rate per engagement, deferred revenue roll forward, and a short list of accounts whose margin dropped enough to warrant a pricing conversation.
Numbers worth watching
Each one is plain math you can check yourself.
| Number | How to figure it | Good range | Why it matters |
|---|---|---|---|
| Gross margin per client | (Client revenue − delivery payroll on that client − contractors − pass-through cost) ÷ client revenue | 50–60% for agencies, 40–55% for staffed consultancies | Averages hide the account that eats the team. This finds it. |
| Utilization rate | Billable hours ÷ available hours | 65–75% for full-time delivery staff | Above 85 percent is not efficiency, it is a burnout schedule with turnover attached. |
| Realization rate | Revenue billed ÷ (hours worked × standard rate) | Above 85% | It measures the discounting and over-servicing that never shows up on an invoice. |
| Effective hourly rate | Total client fee ÷ total hours actually worked on that client | Within 15% of your rate card | The single best test of whether a fixed fee was priced correctly. |
| Revenue per delivery employee | Annualized revenue ÷ delivery headcount | $150k–$250k depending on discipline | Shows whether growth came from leverage or just from more people. |
| Overhead as a share of revenue | Non-delivery costs ÷ revenue | 25–35% | The gap between gross margin and this number is your net. |
| Revenue concentration | Largest client revenue ÷ total revenue | Under 25% | It is a risk number, and it belongs on the dashboard next to the profit ones. |
Typical results we see
Clients found below target margin
20–30%
Almost always scope creep, not rate.
Realization before tracking
68–78%
Rises quickly once it is visible.
Revenue chart smoothing
Immediate
Once retainers move to deferred revenue.
A $9,000 per month retainer, one month of delivery
- Retainer revenue recognized
- $9,000
- Hours worked on the account
- 112
- Effective hourly rate
- $80.36
- Rate card equivalent
- $135
- Realization rate
- 59.5%
- Delivery payroll allocated
- ($6,050)
- Contractor design work
- ($1,200)
- Gross margin
- $1,750 (19.4%)
What this tells you: The retainer was invoiced on time and the client was happy, but at 19.4 percent margin it could not carry overhead. The scope had grown by two deliverables over eighteen months without a price change.
What you see inside LedgerDude
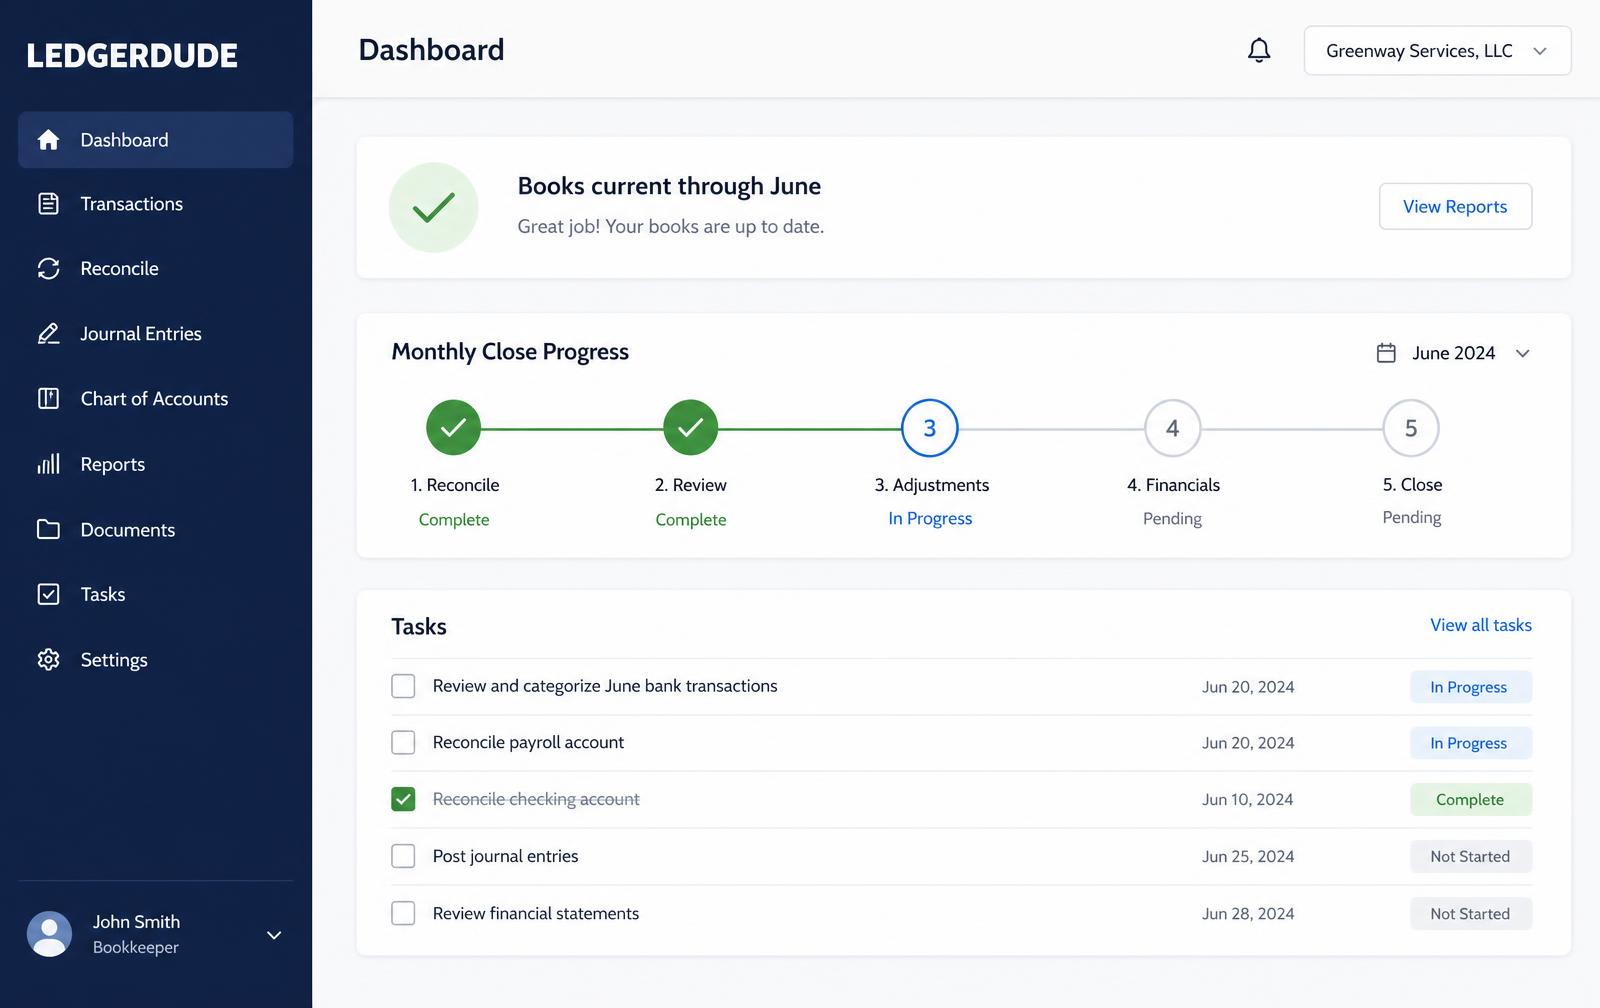
We put gross margin per client and the rest of these numbers on one page, refreshed as your books are closed each month.
How to build agency KPIs in one close cycle
- 1
Split payroll into delivery and overhead
Assign each role, and use a tracked ratio for people who do both.
- 2
Move retainers into deferred revenue
Recognize as work is delivered so the revenue chart reflects reality.
- 3
Track hours on every engagement
Including fixed fee. Hours do not need to be billed to be counted.
- 4
Tag revenue and delivery cost by client
Use classes or projects so margin per client comes straight from the books.
- 5
Calculate utilization and realization per person
Billable divided by available, and billed divided by worked at standard rate.
- 6
Compute the effective hourly rate per client
Total fee divided by total hours worked, compared against your rate card.
- 7
Review the bottom three accounts every quarter
Reprice, rescope, or resign. Doing nothing is the expensive option.
Real example
A 14-person marketing agency with three accounts eating the year
Where they started: An agency at $2.8M in revenue had payroll in one account, retainers recognized when invoiced, and no hour tracking on fixed-fee work. Profit hovered near 6 percent and the founders could not say which clients were worth keeping.
What we did: We split payroll into delivery and overhead, moved retainers to deferred revenue, introduced lightweight weekly time logging, and built gross margin per client with an effective hourly rate for every engagement.
How it ended up: Three of nineteen clients ran below 25 percent margin and consumed 38 percent of delivery hours. Two were repriced with tightened scope, one declined and left. Net margin reached 19 percent within two quarters with the same headcount.
6% → 19%
Net margin
71% → 89%
Realization
0
Headcount added
“Losing that client was the most profitable thing we did all year. We only knew because the number was finally in front of us.”
Questions people ask
We price fixed fee. Why track hours at all?
Because the fee no longer self-corrects. On fixed fee, hours are the only evidence about whether the price works. A rough weekly log is enough to produce an effective hourly rate.
Should contractors be cost of revenue or overhead?
Contractors delivering client work are cost of revenue. A contract bookkeeper or recruiter is overhead. The test is whether the client work would still get delivered without them.
What utilization should we target?
65 to 75 percent for full-time delivery staff. Higher targets look efficient on a spreadsheet and produce turnover, unpaid overruns and quality problems that cost more than the extra hours are worth.
How do we handle pass-through costs like ad spend or print?
Keep them separate from fee revenue. Netting them together inflates revenue and crushes apparent margin, which makes benchmarking against other firms meaningless.
Can margin per client be automated?
Mostly. Revenue and direct costs tag automatically from the books; the payroll allocation needs a monthly review, which is part of our close.
What does this cost?
One flat monthly price. No hourly bills, no surprises. Founding plans start at $149 a month, and your rate stays locked.
Keep reading
Ecommerce KPIs that come straight out of your books
Start with contribution margin per order — for shopify, amazon and etsy sellers doing $200k to $5m a year.
Construction and trades KPIs built from job-level books
Start with gross profit per job — for general contractors, remodelers, electrical, plumbing and hvac companies.
Short-term rental KPIs measured per unit, per month
Start with net operating income per unit — for airbnb and vrbo hosts and small property managers with 1 to 30 units.
All KPI Library pages
Every industry we have written numbers for, in one list.
Outsourced bookkeeping services
Who does the work behind these numbers each month.
Pricing
Flat monthly plans based on your revenue, with catch-up quoted separately.
Want your books handled for you?
We read your receipts, match your bank activity, and close your books every month. You get one short list of questions and a dashboard that always tells the truth.