
KPI Library
Short-term rental KPIs measured per unit, per month
Net operating income per unit, RevPAR, cleaning recovery and cash-on-cash return, plus the payout reconciliation behind them.
The short answer
- Short-term rental books only work per unit. Portfolio totals hide the one property that loses money every winter.
- Platform payouts are net of host service fees, and sometimes of taxes and damage waivers. Booking the payout as revenue understates both gross rent and expense.
- Cleaning fees collected and cleaning fees paid are two separate lines. Netting them hides whether cleaning is actually cost neutral.
- RevPAR — revenue per available night — is more honest than occupancy, because it captures both how full and how well priced the unit was.
- Mortgage payments are not an expense. Only interest is; principal reduces a loan balance and belongs on the balance sheet.
One property, one set of books
The most common short-term rental bookkeeping failure is a single lump of income and a single lump of expenses across every property. It looks tidy and tells you nothing. Every unit needs its own tag so revenue, cleaning, supplies, utilities, repairs, mortgage interest and management fees roll up per door. Once that exists, decisions about pricing, refurbishment and selling become obvious rather than emotional.
- Gross booking revenue, discounts and cleaning fees collected are separate lines
- Platform host fees are an expense, not a revenue reduction
- Occupancy taxes collected are a liability until remitted
- Damage deposits and waivers are neither revenue nor expense until resolved
Reconciling payouts is most of the work
A single payout can cover parts of several reservations, span a month boundary and carry an adjustment for a cancellation. We reconcile payout by payout against reservation detail, so gross rent, cleaning, taxes and fees are all recorded in the month the stay occurred. That is what makes a month-over-month RevPAR chart meaningful instead of noise created by payout timing.
Seasonality is the point, not a problem
Most short-term rental portfolios have two or three months that carry the year. Clean per-unit books make that visible far enough ahead to plan for it: build the reserve in peak season, schedule big repairs in the trough, and stop panicking in the slow month. A twelve-month trailing view per unit is the single most useful chart a host can have.
Know your real cost per stay
Cleaning, consumables, laundry, restocking and the credit card fee on the booking all belong to the stay. Divide those by nights booked and you get a floor price. Hosts who discount below that floor to chase occupancy usually end up busier and poorer, which is exactly what net operating income per unit exposes.
What LedgerDude produces for a host each month
Per-unit income statements, a payout reconciliation, RevPAR and occupancy trends, cleaning recovery, a tax-ready split of interest versus principal, and a heads-up when any unit's twelve-month net operating income turns negative.
Numbers worth watching
Each one is plain math you can check yourself.
| Number | How to figure it | Good range | Why it matters |
|---|---|---|---|
| Net operating income per unit | Unit revenue − operating expenses, before mortgage principal and depreciation | Positive every trailing twelve months | It is the number a buyer, a lender and you should all judge the property by. |
| RevPAR | Total rental revenue ÷ available nights | Rising year over year for the same unit | Combines occupancy and rate, so it cannot be gamed by discounting. |
| Occupancy rate | Nights booked ÷ nights available | 60–75% in most markets | Useful only alongside RevPAR. High occupancy at a bad rate is a losing strategy. |
| Cleaning recovery | Cleaning fees collected ÷ cleaning costs paid | 0.9–1.1× | Below 0.9 you are subsidizing turnovers on every stay. |
| Operating expense ratio | Operating expenses ÷ rental revenue | 45–60% self-managed, 60–75% professionally managed | Drift here is the earliest sign a unit is aging into a money pit. |
| Cash-on-cash return | (Net operating income − mortgage interest and principal) ÷ cash invested | 8–12% | The number that compares this property against every other use of your money. |
| Cost per stay | (Cleaning + consumables + laundry + booking fees) ÷ stays | Known and used as a pricing floor | Sets the minimum nightly rate that is worth accepting. |
Typical results we see
Revenue understated by payout posting
12–18%
Host fees and taxes buried in net payouts.
Hosts subsidizing cleaning
About half
Fee never raised after cleaner rate increases.
Deductions recovered in cleanup
$4k–$22k
Supplies, mileage and interest split.
One two-bedroom unit, a full month in shoulder season
- Gross booking revenue
- $7,420
- Cleaning fees collected
- $1,050
- Platform host fees
- ($223)
- Cleaning paid to cleaners
- ($1,275)
- Supplies and consumables
- ($188)
- Utilities and internet
- ($395)
- Repairs and maintenance
- ($610)
- Insurance and property tax accrual
- ($742)
- Net operating income
- $5,037
- Mortgage interest
- ($2,310)
- Cash flow after debt service
- $1,842
What this tells you: The unit is healthy, but cleaning recovery is 0.82 — the host is absorbing $225 a month because the cleaning fee was never raised after the cleaner's rate went up. That is $2,700 a year on one door.
What you see inside LedgerDude
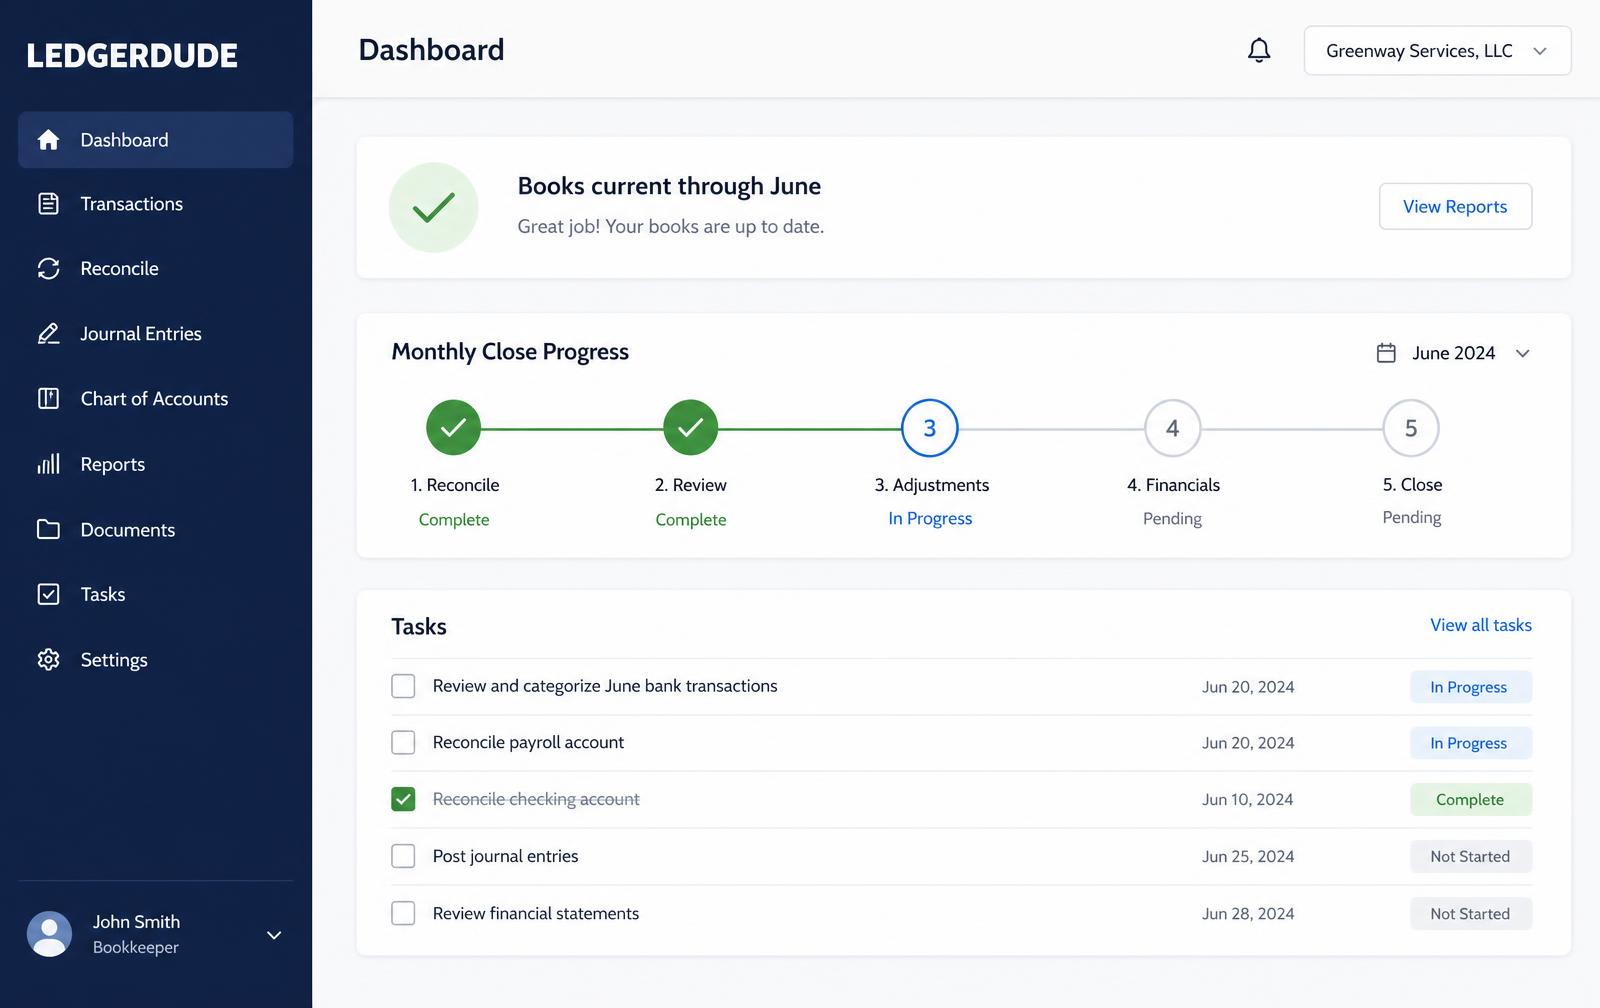
We put net operating income per unit and the rest of these numbers on one page, refreshed as your books are closed each month.
How to set up short-term rental KPIs per unit
- 1
Give every unit its own tag
A class, location or project so all revenue and cost roll up per door.
- 2
Import reservation detail, not just payouts
Gross rent, cleaning fee, discounts and taxes belong on separate lines.
- 3
Record platform host fees as an expense
Never as a reduction of revenue, or your fee rate becomes invisible.
- 4
Split cleaning collected from cleaning paid
Two lines, so recovery can be measured and the fee kept current.
- 5
Split the mortgage payment
Interest is an expense; principal reduces the loan on the balance sheet.
- 6
Accrue insurance and property tax monthly
Otherwise two months a year look catastrophic and the rest look better than they are.
- 7
Review trailing twelve-month NOI per unit
Seasonal businesses should never be judged on a single month.
Real example
A nine-unit host who could not tell which doors made money
Where they started: A host with nine units across two markets recorded every Airbnb and Vrbo payout as one income line and every expense in one bucket. The portfolio appeared profitable, cash was always tight, and two units were being considered for sale based on gut feel.
What we did: We rebuilt two years per unit from reservation-level data, reconciled every payout, separated cleaning collected from cleaning paid, split mortgage payments into interest and principal, and set up occupancy tax as a liability.
How it ended up: Seven units were solidly profitable. One lost money nine months of the year, and it was not either of the two the host had been planning to sell. Cleaning fees were raised across the portfolio, and the loser was converted to a mid-term rental.
$22,300
Deductions recovered
$14,900/yr
Cleaning subsidy eliminated
9 of 9
Units correctly identified
“I was about to sell the wrong property. Per-unit numbers changed the whole plan in one afternoon.”
Questions people ask
Do I need separate books for each property?
Not separate files — separate tags inside one file. That gives per-unit reporting without multiplying subscriptions or reconciliations.
Is my whole mortgage payment deductible?
No. Interest is an expense; principal repays the loan and appears on the balance sheet. Expensing the whole payment overstates costs and can misstate your tax return.
How should occupancy taxes be handled?
As a liability when collected and cleared when remitted. If the platform remits on your behalf it should never touch your income at all.
Is occupancy or RevPAR the better number?
RevPAR. Occupancy alone rewards discounting. RevPAR captures both how full the unit was and how well it was priced, which is what actually pays the mortgage.
What about furnishings and appliances?
Larger items are usually capitalized and depreciated rather than expensed on purchase. We tag them as they occur so your tax preparer is not reconstructing the year in April.
What does this cost?
One flat monthly price. No hourly bills, no surprises. Founding plans start at $149 a month, and your rate stays locked.
Keep reading
Ecommerce KPIs that come straight out of your books
Start with contribution margin per order — for shopify, amazon and etsy sellers doing $200k to $5m a year.
Construction and trades KPIs built from job-level books
Start with gross profit per job — for general contractors, remodelers, electrical, plumbing and hvac companies.
Agency and professional services KPIs from the books up
Start with gross margin per client — for marketing agencies, design studios, consultancies and law or engineering firms.
All KPI Library pages
Every industry we have written numbers for, in one list.
Outsourced bookkeeping services
Who does the work behind these numbers each month.
Pricing
Flat monthly plans based on your revenue, with catch-up quoted separately.
Want your books handled for you?
We read your receipts, match your bank activity, and close your books every month. You get one short list of questions and a dashboard that always tells the truth.