
KPI Library
Ecommerce KPIs that come straight out of your books
The seven numbers an online store should read every month, how to build each one from real bookkeeping data, plus healthy ranges.
The short answer
- An online store's most important number is contribution margin per order: price minus product cost, payment fees, shipping and packaging. If that number is thin, more sales make things worse, not better.
- Marketplace payouts arrive net of fees. Booking the payout as revenue hides 8 to 20 percent of both sales and expense, which quietly breaks every other number on this page.
- Inventory must be counted, not guessed. Purchases are not cost of goods sold, and treating them that way makes profitable months look terrible and bad months look fine.
- Ad spend belongs next to gross profit, not next to sales. Blended MER on revenue flatters you; MER on gross profit tells the truth.
- Refunds and chargebacks are a real cost line. Above 2 percent of sales, they eat a whole margin point on their own.
Where ecommerce numbers usually go wrong
Almost every broken ecommerce dashboard we inherit has the same root cause: the books are built from bank deposits instead of from settlement reports. A Shopify Payments payout, an Amazon disbursement and a Stripe transfer are all net figures. They already had processing fees, referral fees, FBA fees, ad deductions, refunds and reserves taken out. When that single net number lands in the books as sales, gross revenue is understated, every fee category disappears, and margin percentages become fiction.
- Gross sales, discounts, shipping income and sales tax collected each need their own line
- Platform fees, payment fees and fulfillment fees are expenses, not a reduction of revenue
- Refunds reverse revenue and, if the item comes back, restore inventory
- Reserves and rolling holds are receivables, not lost money
Build the numbers on a clean revenue block first
Before any KPI means anything, one month of sales has to reconcile three ways: platform gross sales, the settlement report, and the cash that actually hit the bank. We post a summarized journal entry per platform per settlement period, so the difference between what you sold and what you received is always explainable line by line. Once that ties, the seven numbers below fall out of the books automatically instead of being rebuilt in a spreadsheet each month.
Inventory is the difference between a guess and a number
Cost of goods sold is beginning inventory plus purchases minus ending inventory. Stores that expense purchases as they buy will show a loss in a big restock month and a fat profit in a slow one. If a full count is impractical, we use a landed-cost-per-SKU roll forward and true it up to a count each quarter. Landed cost means product cost plus freight in, duty and inbound handling — not just the invoice from the supplier.
Marketing efficiency has to be measured against margin
A 3.0 return on ad spend sounds healthy until you notice the product only carries a 35 percent gross margin, which means the ads lost money. We report marketing efficiency two ways every month: against revenue, because that is the number your agency reports, and against gross profit, because that is the number your bank account feels.
What LedgerDude produces for an online store each month
By the tenth we deliver a reconciled revenue block per channel, a landed-cost inventory roll, a fee breakdown per platform, contribution margin by channel, and a one-page read on which of these seven numbers moved and why. Anything ambiguous comes back to you as a short list of questions, not a spreadsheet to audit.
Numbers worth watching
Each one is plain math you can check yourself.
| Number | How to figure it | Good range | Why it matters |
|---|---|---|---|
| Contribution margin per order | (Net revenue − product cost − payment fees − platform fees − shipping and packaging) ÷ orders | At least 2.5× your blended customer acquisition cost | It is the only number that tells you whether the next order helps or hurts. |
| Gross margin percentage | (Net revenue − cost of goods sold) ÷ net revenue | 50–65% direct-to-consumer, 30–45% marketplace resale | Everything downstream — ad budget, headcount, freight tolerance — is set by this ceiling. |
| Marketing efficiency on gross profit | Gross profit ÷ total ad and marketing spend | Above 1.5× | Return on ad spend measured on revenue hides unprofitable growth; this version does not. |
| Total platform fee rate | (Payment + referral + fulfillment + storage fees) ÷ gross sales | 3–6% own store, 20–35% marketplace | Fee creep is silent. A one-point rise wipes out a normal price increase. |
| Inventory turns | Cost of goods sold ÷ average inventory value | 4–8 turns per year for most consumer goods | Slow turns mean your profit is sitting on a shelf instead of in the bank. |
| Refund and chargeback rate | (Refunds + chargebacks) ÷ gross sales | Under 2% | Rising returns usually signal a product or listing problem months before reviews do. |
| Cash conversion days | Inventory days + payout delay days − supplier payment days | Under 60 days | Profitable stores still run out of money here. It explains why growth feels tight. |
Typical results we see
Revenue understated before cleanup
8–20%
Typical gap when payouts were booked as sales.
Margin found in the first close
3–6 pts
Mostly fee reclassification and landed cost.
Time owners spend on books after
Under 30 min/mo
Answering questions, not building spreadsheets.
One month for a $180,000 direct-to-consumer store
- Gross sales
- $180,000
- Discounts and refunds
- ($14,400)
- Net revenue
- $165,600
- Landed cost of goods sold
- ($66,200)
- Payment and platform fees
- ($7,900)
- Shipping and packaging
- ($16,100)
- Contribution margin
- $75,400 (45.5%)
- Ad spend
- ($48,000)
- Marketing efficiency on gross profit
- 1.57×
- Contribution after ads
- $27,400
What this tells you: Reported return on ad spend was 3.45×, which looked excellent. Measured against gross profit it was 1.57× — still positive, but only $27,400 was left to cover payroll, software and rent. That is the number to run the business on.
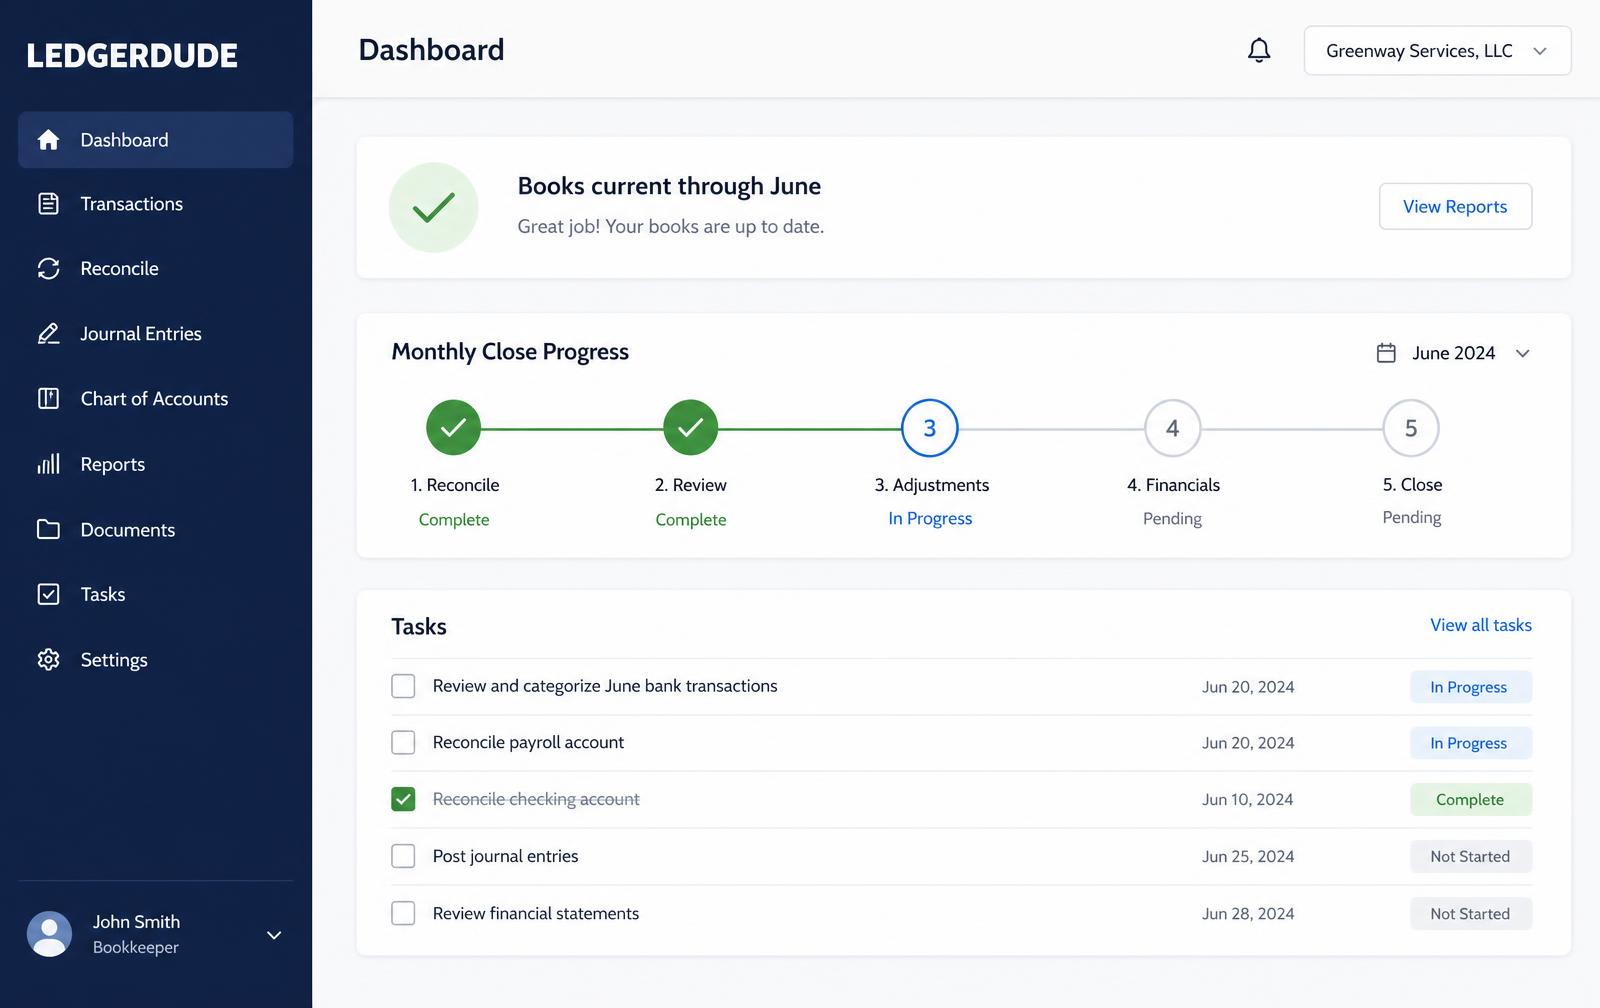
What you see inside LedgerDude
We put contribution margin per order and the rest of these numbers on one page, refreshed as your books are closed each month.
How to build ecommerce KPIs you can trust
- 1
Pull the settlement report, not the bank deposit
Export the platform settlement for the period. It shows gross sales, every fee and every refund behind the net payout.
- 2
Post a summarized revenue journal entry
Record gross sales, discounts, refunds, shipping income and sales tax collected, then each fee category, then the net cash.
- 3
Set landed cost per SKU
Product cost plus freight in, duty and inbound handling. Update it whenever a supplier price or freight rate changes.
- 4
Roll inventory and book cost of goods sold
Beginning inventory plus purchases minus ending inventory, trued to a count at least quarterly.
- 5
Calculate contribution margin by channel
Net revenue minus product cost, fees, shipping and packaging, split by store, marketplace and wholesale.
- 6
Compare ad spend to gross profit
Divide gross profit by total marketing spend. Below 1.5× means growth is being bought at a loss.
- 7
Review the seven numbers together
Trends matter more than any single month. Look at three months side by side before changing prices or budgets.
Real example
A home goods store that thought it had a 62 percent margin
Where they started: A three-year-old Shopify and Amazon seller doing about $2.1M a year booked every payout as revenue and expensed inventory purchases when paid. Their profit and loss showed 62 percent gross margin and swung between a $40,000 profit and a $30,000 loss month to month with no obvious reason.
What we did: We rebuilt fourteen months from settlement reports, split out referral, FBA and storage fees, moved freight and duty into landed cost, and put inventory on a per-SKU roll forward trued to a physical count. Then we set up contribution margin reporting by channel and by product family.
How it ended up: True gross margin was 47 percent, not 62. Amazon carried a 31 percent fee load and two product families lost money on every unit sold. Those SKUs were discontinued, Amazon pricing was raised 9 percent, and ad budget moved to the store's own channel.
+9 pts
Blended margin gain in 6 months
11
Unprofitable SKUs retired
−78%
Month-to-month profit swing
“We were paying Amazon to sell two of our products and had no idea. The fee breakdown alone paid for the year.”
Questions people ask
Is return on ad spend a bookkeeping number?
The spend side is. Ad platforms report their own attributed revenue, which rarely matches your books. We report marketing efficiency using actual booked revenue and actual gross profit, so it reconciles to your profit and loss instead of to a dashboard.
Do I really need inventory counts to get accurate numbers?
You need a defensible inventory value at both ends of the period. A per-SKU roll forward from landed cost works month to month, but it drifts, so it should be trued to a physical count at least quarterly and always at year end.
How should sales tax collected show up?
As a liability, never as revenue. Money you collected for a state is money you are holding. Booking it as income overstates revenue and produces a tax bill you did not earn.
What is a healthy contribution margin for a small store?
Aim for contribution margin per order at roughly 2.5 times your blended acquisition cost. Below 2 times, the business only works if repeat purchase rates are strong and provable.
Can you fix months that were already recorded wrong?
Yes. Catch-up and cleanup work rebuilds prior months from settlement reports so your trend lines are comparable. Without that, a clean current month next to a broken prior month makes every percentage change meaningless.
What does this cost?
One flat monthly price. No hourly bills, no surprises. Founding plans start at $149 a month, and your rate stays locked.
Keep reading
Construction and trades KPIs built from job-level books
Start with gross profit per job — for general contractors, remodelers, electrical, plumbing and hvac companies.
Agency and professional services KPIs from the books up
Start with gross margin per client — for marketing agencies, design studios, consultancies and law or engineering firms.
Short-term rental KPIs measured per unit, per month
Start with net operating income per unit — for airbnb and vrbo hosts and small property managers with 1 to 30 units.
All KPI Library pages
Every industry we have written numbers for, in one list.
Outsourced bookkeeping services
Who does the work behind these numbers each month.
Pricing
Flat monthly plans based on your revenue, with catch-up quoted separately.
Want your books handled for you?
We read your receipts, match your bank activity, and close your books every month. You get one short list of questions and a dashboard that always tells the truth.