
KPI Library
Trucking KPIs built on a real cost per mile
Cost per mile, net revenue per loaded mile, deadhead percentage and days to get paid: how small fleets build each from the books.
The short answer
- Everything in trucking rests on one number: total cost per mile, fixed plus variable. Without it, no rate can be judged as good or bad.
- Net revenue per loaded mile — gross rate minus fuel, tolls, factoring fees and broker deductions, divided by loaded miles — is what you compare to cost per mile.
- Deadhead miles cost real money and earn none. Every empty mile raises your effective cost per loaded mile.
- Truck payments split into interest and principal, and major repairs should be reserved for monthly instead of shocking a single month.
- Days to get paid is a survival number. Fuel is bought weekly; brokers pay in 30 to 45 days.
Cost per mile is the whole game
Fixed costs — truck payment interest, insurance, permits, ELD subscriptions, parking, accounting — accrue whether the truck moves or not. Variable costs — fuel, tires, maintenance, tolls, driver pay — accrue by mile. Add them and divide by total miles and you get the number that turns every load board rate into a yes or a no in five seconds. Most owner-operators we meet are within 20 cents of knowing it, and those 20 cents are the difference between a good year and a rough one.
- Fixed cost per mile falls as you run more miles, which is why idle weeks hurt twice
- Maintenance should be accrued per mile, not expensed when the shop bill lands
- Owner pay is a real cost and belongs in the calculation
- Fuel surcharge is revenue, tracked separately from line haul
Read the settlement, not the deposit
A broker or factoring settlement carries the gross rate and then deductions: advances, fuel advances, factoring fees, insurance chargebacks, detention adjustments and lumper reimbursements. When only the net deposit is recorded, revenue is understated and the fee categories vanish, so nobody can tell that a factoring rate crept from 2 to 3.5 percent. We record gross rate and each deduction so the true cost of getting paid is visible.
Deadhead and the effective cost per loaded mile
You can only bill loaded miles, but you pay for all of them. At 15 percent deadhead, a $1.75 cost per mile becomes about $2.06 per loaded mile. Fleets that track deadhead by lane usually find one or two routes that only look profitable because the empty return leg was never charged against them.
Maintenance reserves keep the trend readable
One engine job can turn a good month into a loss and make a twelve-month trend unreadable. We accrue a maintenance reserve per mile based on your equipment age and true it up against actual spend each quarter. The month a repair happens then shows the reserve being used rather than a cliff, and your cost per mile stops jumping around.
What LedgerDude produces for a fleet each month
Cost per mile split fixed and variable, net revenue per loaded mile by truck and by lane, deadhead percentage, fuel efficiency, a factoring and deduction summary, receivables aging by broker, and a flag on any lane running below your cost per mile.
Numbers worth watching
Each one is plain math you can check yourself.
| Number | How to figure it | Good range | Why it matters |
|---|---|---|---|
| Total cost per mile | (Fixed costs + variable costs) ÷ total miles driven | $1.55–$2.05 for a single-truck operation | Every rate decision is a comparison against this one number. |
| Net revenue per loaded mile | (Gross rate − fuel − tolls − factoring fees − deductions) ÷ loaded miles | At least $0.45 above total cost per mile | It is the actual spread you keep, not the rate on the load board. |
| Deadhead percentage | Empty miles ÷ total miles | Under 12% | Empty miles raise the cost of every loaded mile you can bill. |
| Fuel cost per mile | Total fuel spend ÷ total miles | Track against MPG and regional price shifts | A 0.4 MPG slide is invisible in dollars and obvious per mile. |
| Maintenance cost per mile | (Repairs + tires + preventive maintenance, accrued) ÷ miles | $0.14–$0.22 depending on equipment age | Accrual is what stops one repair from erasing a good quarter on paper. |
| Days to get paid | Average days from delivery to cash received | Under 30 days, or under 3 with factoring | Fuel is weekly, brokers are monthly. This gap is why cash feels tight. |
| Revenue per truck per week | Total revenue ÷ trucks ÷ weeks in service | $4,500–$6,500 for dry van, higher for specialized | The quickest read on whether a truck is earning its fixed cost. |
Typical results we see
Owner-operators who know cost per mile
Fewer than half
Most estimate within about 20 cents.
Factoring fee creep found
0.5–1.5 pts
Invisible when only net deposits are booked.
Lanes found below cost
1 in 5
Usually because of the empty return leg.
One truck, one month, 9,200 miles
- Gross line haul revenue
- $21,850
- Fuel surcharge
- $2,940
- Fuel
- ($6,720)
- Driver and owner pay
- ($6,000)
- Maintenance accrual at $0.18/mi
- ($1,656)
- Insurance, permits and ELD
- ($1,890)
- Truck loan interest
- ($640)
- Factoring fees at 2.5%
- ($619)
- Tolls, parking, scales
- ($430)
- Total cost
- ($17,955)
- Total cost per mile
- $1.95
- Loaded miles (13% deadhead)
- 8,004
- Net revenue per loaded mile
- $2.72
What this tells you: The spread is $0.77 per loaded mile, which is healthy. Note that cost per mile is $1.95 but the true break-even on loaded miles is $2.24 once deadhead is included — that is the number to quote against.
What you see inside LedgerDude
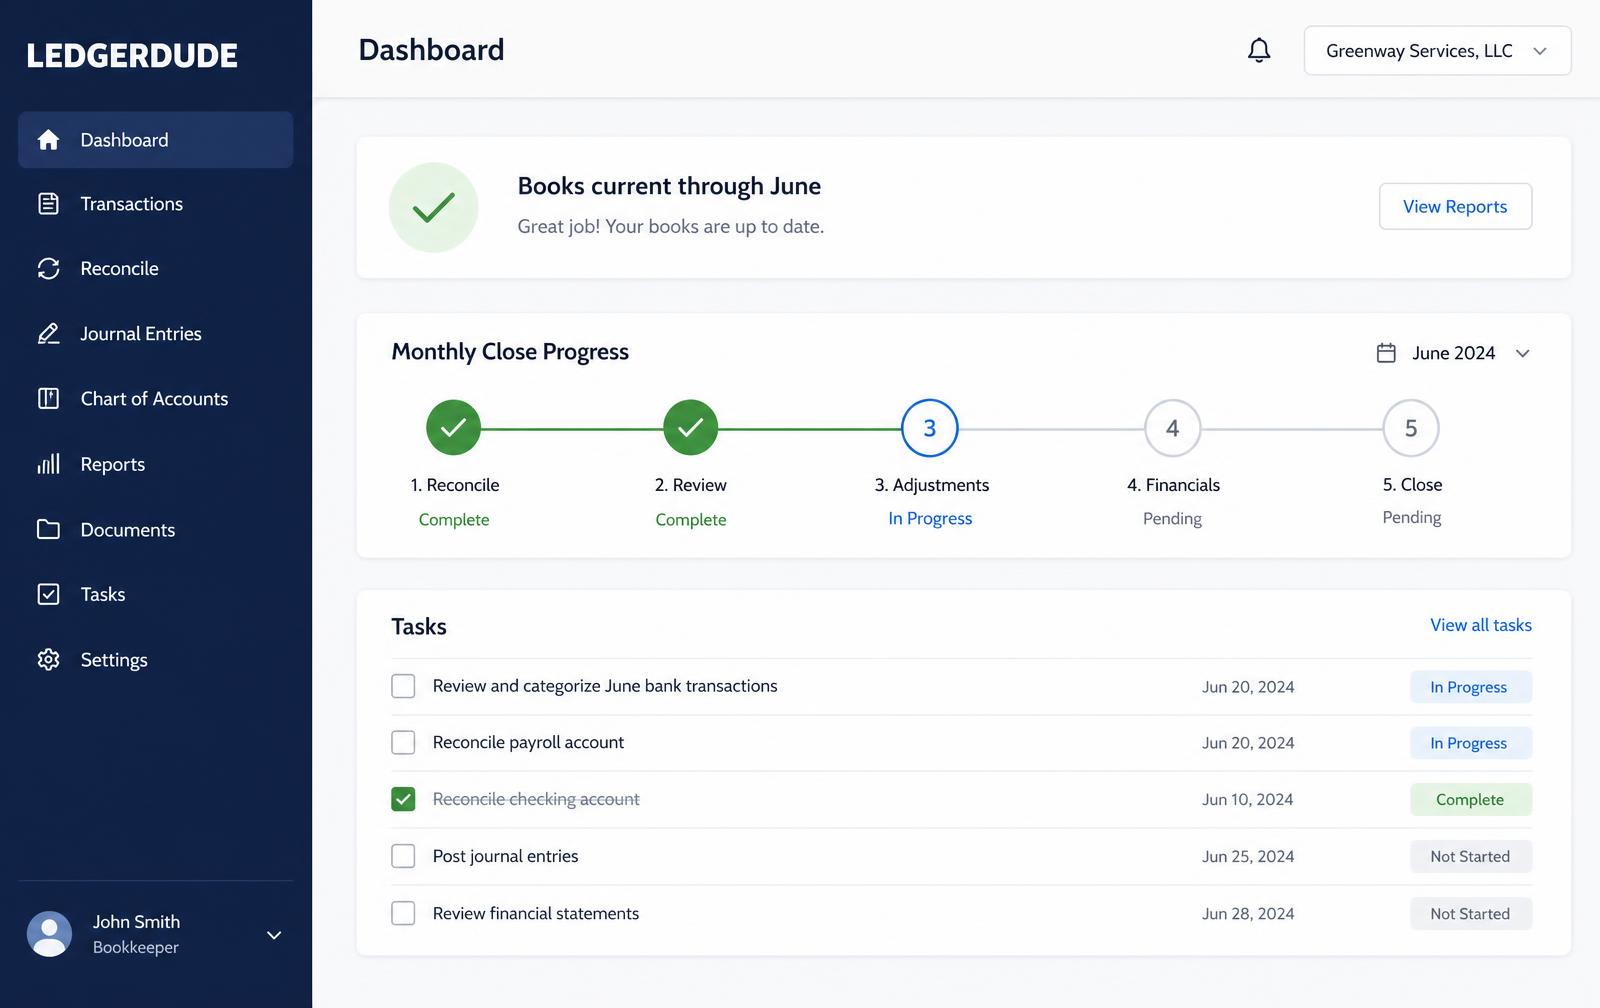
We put net revenue per loaded mile and the rest of these numbers on one page, refreshed as your books are closed each month.
How to calculate cost per mile and use it
- 1
List every fixed cost for a month
Insurance, permits, ELD, parking, truck loan interest, accounting, phone.
- 2
List every variable cost
Fuel, driver pay, tolls, tires, and an accrued maintenance amount per mile.
- 3
Record total and loaded miles
From the ELD, not from memory. The difference is your deadhead.
- 4
Divide total cost by total miles
That is your cost per mile. Recalculate it quarterly.
- 5
Convert to a loaded-mile break-even
Divide cost per mile by (1 − deadhead percentage). That is your quoting floor.
- 6
Record gross rates and deductions separately
So factoring fees, advances and chargebacks stay visible.
- 7
Rank lanes by net revenue per loaded mile
Drop or reprice anything within 30 cents of your floor.
Real example
A five-truck fleet running one lane at a loss
Where they started: A regional dry van fleet booked net factoring deposits as revenue and expensed repairs when paid. Revenue looked strong, two months a year showed steep losses, and rate decisions were made by comparing against what the dispatcher remembered.
What we did: We rebuilt a year from settlement detail, separated gross rate from every deduction, put maintenance on a per-mile accrual, split truck payments into interest and principal, and built cost per mile per truck plus profitability by lane.
How it ended up: Cost per mile was $1.98, not the $1.70 they assumed. One recurring lane averaged $1.86 net per loaded mile after a 41 percent deadhead return and had lost roughly $34,000 over the year. It was dropped and replaced from the same shipper's backhaul board.
$34,000
Annual loss removed
19% → 11%
Deadhead
3.1% → 2.2%
Factoring fee renegotiated
“We were proud of that lane because it was steady. Steady and unprofitable is the worst combination there is.”
Questions people ask
Should owner pay be in cost per mile?
Yes. If your time is free in the calculation, every rate looks acceptable. Put a market wage in as a cost so the number tells you whether the business — not just the driving — is profitable.
Is factoring worth it?
Often, if the fee is under about 3 percent and it keeps you moving. The problem is not factoring, it is not seeing the fee. Once it is a visible line on your books it becomes negotiable.
How do I handle a big engine repair?
Accrue a maintenance reserve per mile and draw the repair against it. Your cost per mile stays stable, and the trend stays readable instead of showing a cliff.
Is per diem an expense in my books?
It is handled differently for books and for tax, and the rules depend on your entity type and whether drivers are employees. We track it separately so your tax preparer can apply the right treatment.
How often should cost per mile be recalculated?
Quarterly at minimum, and immediately after any insurance renewal, equipment change or sustained fuel price move.
What does this cost?
One flat monthly price. No hourly bills, no surprises. Founding plans start at $149 a month, and your rate stays locked.
Keep reading
Ecommerce KPIs that come straight out of your books
Start with contribution margin per order — for shopify, amazon and etsy sellers doing $200k to $5m a year.
Construction and trades KPIs built from job-level books
Start with gross profit per job — for general contractors, remodelers, electrical, plumbing and hvac companies.
Agency and professional services KPIs from the books up
Start with gross margin per client — for marketing agencies, design studios, consultancies and law or engineering firms.
All KPI Library pages
Every industry we have written numbers for, in one list.
Outsourced bookkeeping services
Who does the work behind these numbers each month.
Pricing
Flat monthly plans based on your revenue, with catch-up quoted separately.
Want your books handled for you?
We read your receipts, match your bank activity, and close your books every month. You get one short list of questions and a dashboard that always tells the truth.