
Service
Financial reporting that answers questions
Dashboards, trends and a written executive summary each month, so you know what changed, why, and what to do about it.
The short answer
- Reporting is useful when every number can be traced to the transactions behind it in one click.
- The three questions worth answering monthly: did margin move, where did cash go, and what is trending the wrong way.
- LedgerDude generates a written summary of changes and risks for each closed period, reviewed by a human before delivery.
- Dashboards are read-only views over closed books, so the numbers do not change under you.
Metrics that mean something
Revenue, gross margin, operating expenses, net profit and cash movement, each with the prior period beside it. Every card opens the transaction list that produced it, so a surprise takes seconds to explain instead of a week.
Trends, not snapshots
A single month cannot tell you whether costs are drifting. Rolling twelve-month trends surface creep in subscriptions, labor and materials while there is still time to react.
The written summary
Each closed period gets a short written read: the headline, the three biggest changes with dollar amounts, and the risks worth watching. It is generated from your own closed numbers and reviewed before it reaches you.
Ask questions in plain English
Ask LedgerDude answers grounded in your actual ledger — what you spent with a vendor, how margin moved, why payroll jumped — and cites the transactions it used.
Numbers worth watching
Each one is plain math you can check yourself.
| Number | How to figure it | Good range | Why it matters |
|---|---|---|---|
| Gross margin | (Revenue − cost of goods sold) ÷ revenue | Stable or rising | Falling margin on rising revenue is the classic silent failure. |
| Operating cash flow | Cash in from operations − cash out from operations | Positive | Profit is an opinion; cash is a fact. |
| Cash runway | Cash ÷ average monthly net burn | 3+ months | It converts a bank balance into a decision deadline. |
Reading one month's movement
- Revenue
- $186,400 (+7.2%)
- Gross margin
- 41.8% (−2.1 pts)
- Operating expenses
- $54,900 (+$6,100)
- Net profit
- $22,900 (−$1,400)
- Operating cash flow
- $18,300
What this tells you: Revenue rose and profit fell. The summary points at a 2.1 point margin slide plus $6,100 of new operating spend — two specific things to fix, not a vague worry.
What you see inside LedgerDude
What you see when the work is done: one page with your money on it.
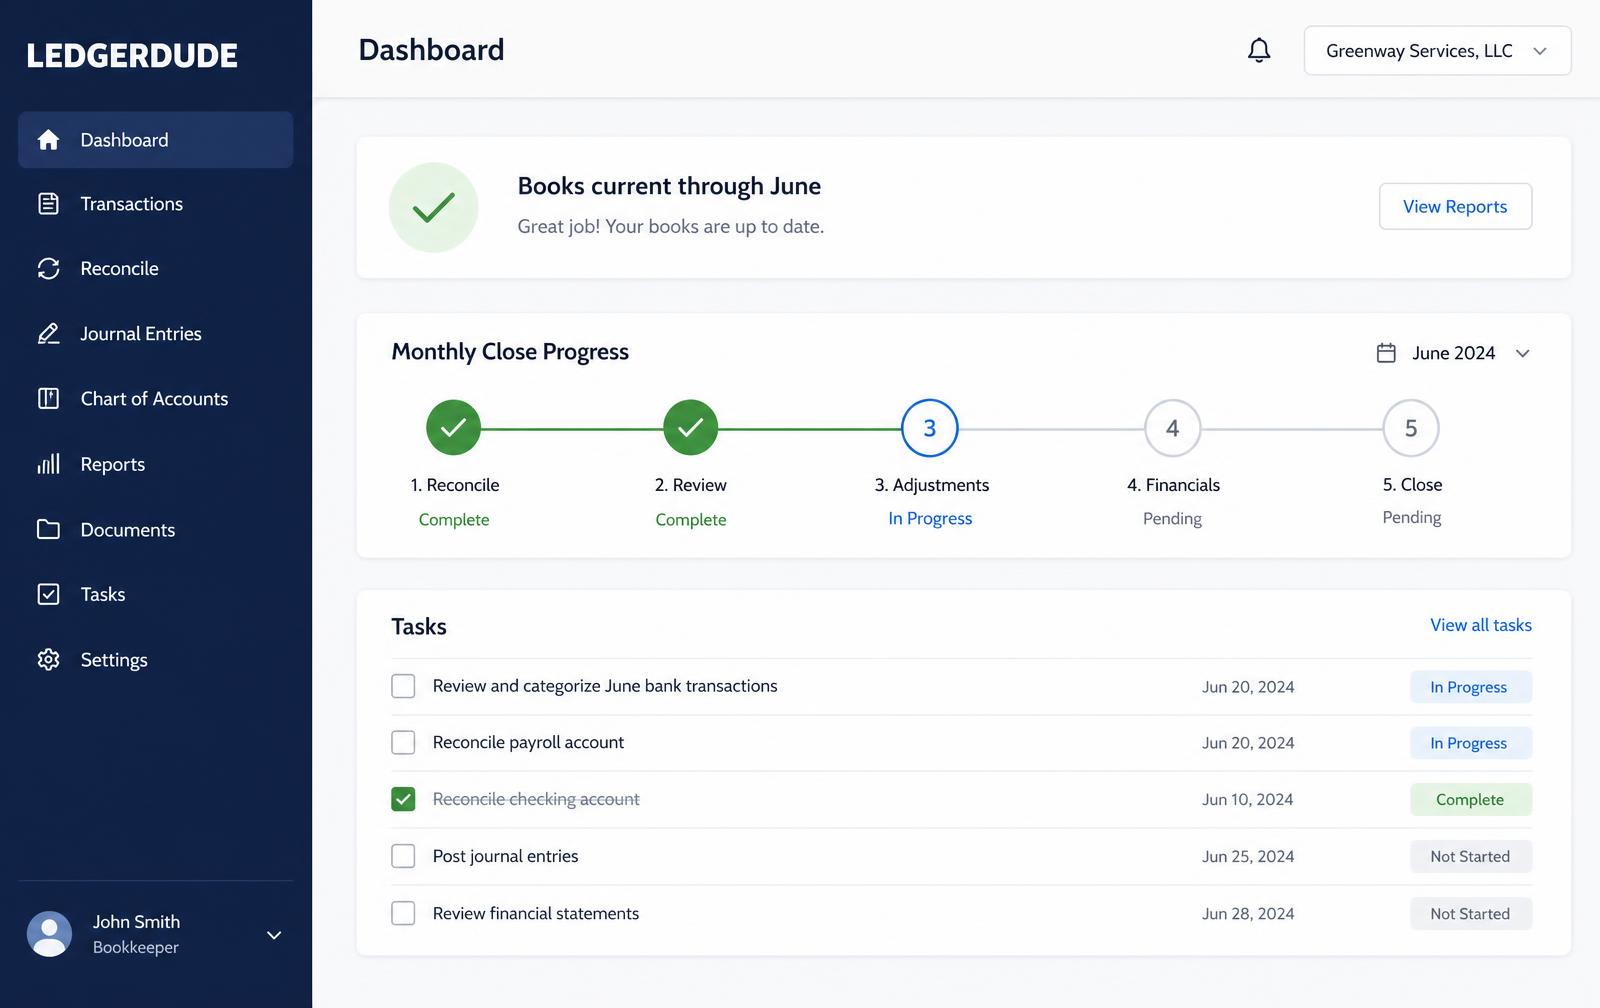
What is included
- Executive metrics with month-over-month movement
- Revenue, expense, cash and profitability dashboards
- Drill-down from any number to the transactions behind it
- Written executive summary of changes and risks
- Ask LedgerDude for plain-English questions about your numbers
Included with monthly bookkeeping plans above the starter tier.
Questions people ask
Can I see the transactions behind a number?
Yes. Every metric and chart segment opens a drill-down list of the transactions that produced it.
Is the written summary reviewed?
Yes. It is generated from your closed numbers and reviewed by a person before it is delivered or emailed.
Do dashboards change after the close?
No. Dashboards read closed periods, so a delivered number stays the same unless a period is formally reopened.
What does this cost?
One flat monthly price. No hourly bills, no surprises. Founding plans start at $149 a month, and your rate stays locked.
Keep reading
A roofing CFO who checks the job made money before the crew leaves town
Finance help for roofing companies: margin by job and crew, real overhead and profit recovery, commission tied to margin, and cash that survives a slow winter.
An electrician CFO who makes sure the bid covered the truck, not just the wire
Finance help for electrical contractors: loaded labor rates, margin by service line, bidding that recovers overhead, and cash planning around slow payers.
A fractional CFO for contractors who need the job numbers to make sense
Finance help built for trade contractors: gross margin by job and crew, loaded labor cost, a 13-week cash forecast, and pricing that covers overhead and profit.
All services
Everything we can take off your plate.
Pricing
Flat monthly plans based on your revenue.
Industries
How we set the books up for your kind of business.
Want your books handled for you?
We read your receipts, match your bank activity, and close your books every month. You get one short list of questions and a dashboard that always tells the truth.