
Quick Answer
What KPIs should an HVAC company track?
The six HVAC KPIs that actually change decisions, what good looks like for each, and how often a heating and air owner should be looking at them.
The short answer
- Six KPIs cover almost every HVAC decision: ticket, margin, billable hours, close rate, agreements and cash.
- Average ticket and close rate are weekly numbers; margin and cash are monthly.
- Billable hour percentage is the most commonly ignored and most damaging number.
- A KPI you do not review on a set day is decoration, not management.
The six that matter
More than six and nothing gets acted on.
- Average ticket — total revenue ÷ completed calls
- Gross margin by line — service, install and maintenance separately
- Billable hour percentage — billed hours ÷ paid hours
- Close rate — sold estimates ÷ presented estimates
- Active maintenance agreements — count and monthly value
- Weeks of cash on hand — cash ÷ average weekly outflow
What good looks like
Service gross margin of 45 to 55 percent, install 30 to 40 percent, billable hours above 65 percent of paid hours, and eight or more weeks of cash. Use these as a sanity check, then compete against your own prior months.
Weekly versus monthly
Ticket and close rate move week to week and respond to coaching. Margin and cash are monthly and respond to pricing and spending decisions. Mixing the two rhythms is why most dashboards get ignored.
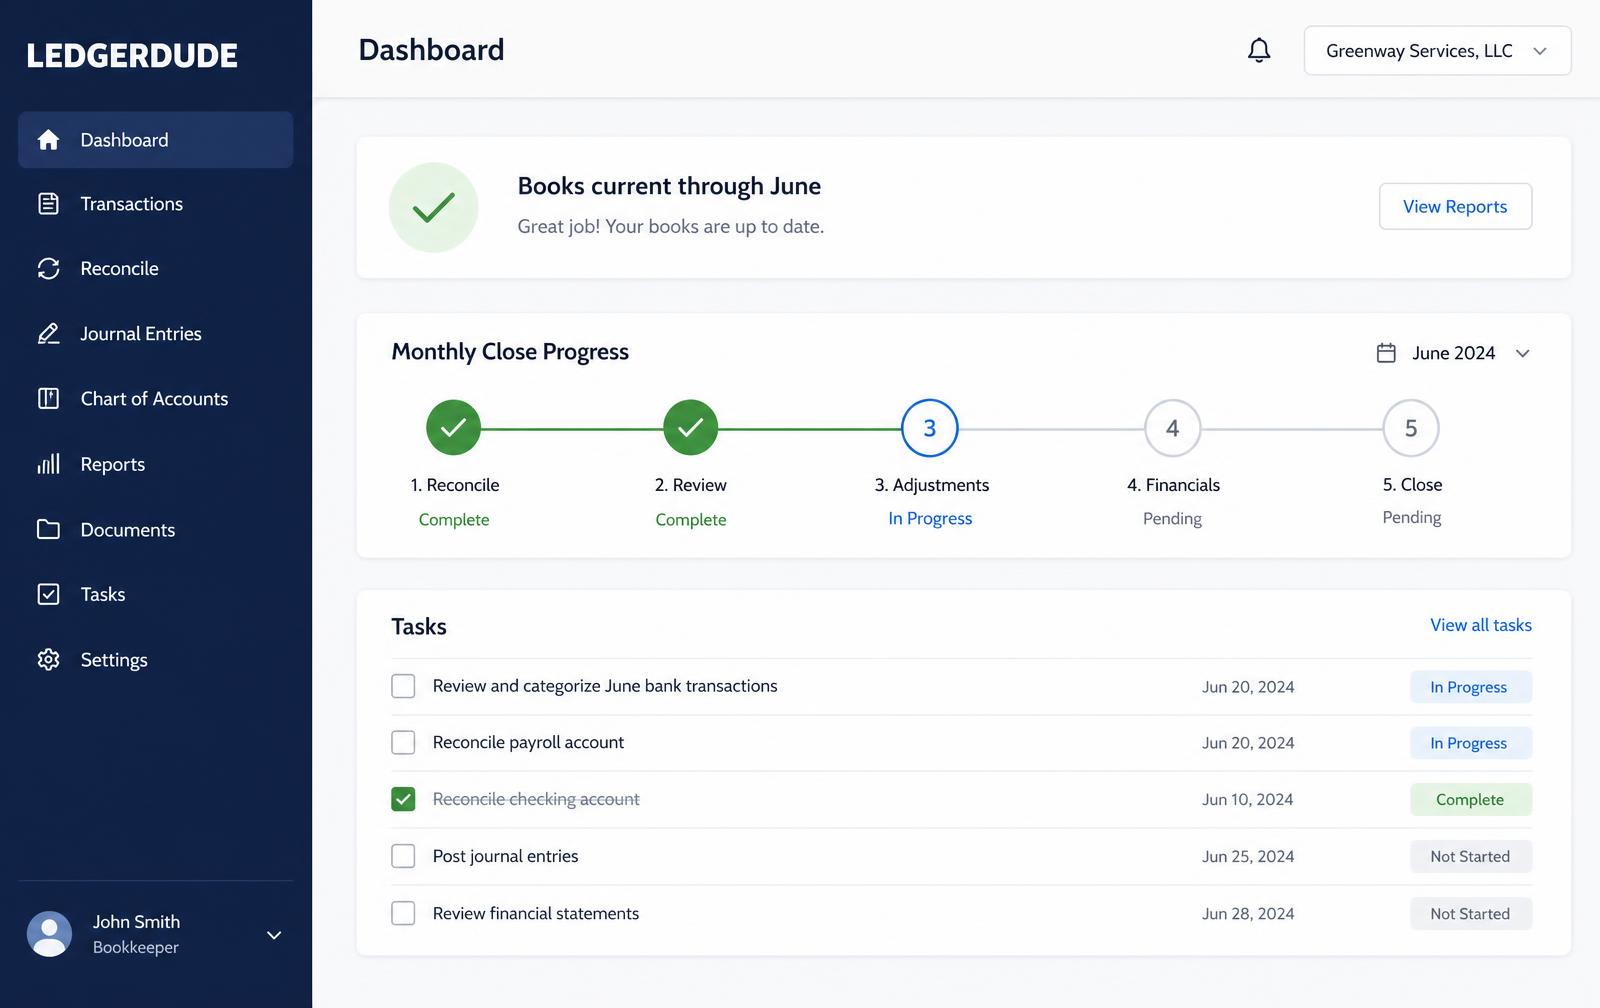
What you see inside LedgerDude
This is the page you get each month once your books are closed — the numbers behind every answer on this site.
In one sentence
Track average ticket, gross margin by revenue line, billable hour percentage, close rate, maintenance agreement count and weeks of cash on hand.
Try it with your own numbers
Use one month, one quarter, or one job. Nothing is saved and nothing is sent anywhere.
What customers paid you.
Units, parts, filters, refrigerant.
Wages, payroll taxes and benefits for time on jobs.
Office, trucks, ads, software, owner pay.
Commissions, permits, subs, disposal — anything that only happens when you do a job.
How many jobs or calls you completed in this period.
Hours your techs actually spent on customer work.
Your target: cents of profit per dollar of sales, after everything.
Gross margin
33.3%
$40,000 left after job costs
Net profit margin
15.0%
$18,000 left after everything
Job costs
66.7%
$80,000 of materials and labor
Materials share
31.7%
Healthy HVAC shops sit near 25–35%.
Labor share
35.0%
Healthy HVAC shops sit near 25–35%.
Overhead share
18.3%
Aim to keep this under 30%.
Contribution margin and labor productivity
Contribution margin
28.3%
$34,000 left to cover overhead and profit
Contribution per job
$243
$857 average sale per job
Sales per labor dollar
$2.86
Most healthy shops make $3 or more of sales per $1 of tech pay.
Sales per tech hour
$109
Your billable rate in real life, after slow days.
Gross profit per tech hour
$36
What one hour of tech time really earns you.
Hours to cover overhead
605 hrs
Tech hours needed before the shop starts making money.
What if costs move?
Drag a slider to see what happens to your margin if labor or materials go up or down.
$42,000 of tech labor
$38,000 of materials
Gross margin, what-if
33.3%
+0.0 points vs now
Net profit, what-if
15.0%
$18,000 left after everything
Both sliders are at zero, so this matches your numbers above.
Your 12% profit target
You are already there. These numbers keep 15.0% after everything.
What this means
Close, but thin. A few points of price or less overhead makes a big difference.
At this margin you need about $66,000 in sales just to break even.
Numbers to watch every month
- • Gross margin per job type — service work should beat installs.
- • Contribution margin — what is left after every cost that moves with the work.
- • Sales and gross profit per tech hour — the fastest read on productivity.
- • Labor cost as a share of sales, including payroll taxes and benefits.
- • Overhead share of sales — it should shrink as you grow.
- • Unpaid customer invoices over 30 days old.
- • Cash in the bank compared with one month of costs.
Related answers
Straight answers to the other questions hvac owners ask us.
How do you price HVAC jobs?
Start from the loaded cost of the job — labor hours, parts, and a share of overhead — then divide by one minus your target margin to get the price.
What is a good profit margin for an HVAC business?
Aim for 45% to 55% gross margin on service, 30% to 40% on installs, and 8% to 12% net profit for the whole company.
What markup should HVAC companies use on parts and equipment?
Most HVAC companies mark parts up 2x to 3x cost and equipment 1.4x to 1.8x, which lands them at 30 to 55 percent gross margin depending on the work.
How does job costing work for an HVAC company?
Job costing tags every labor hour, part and subcontractor cost to a specific job so you can see the gross profit of that job instead of a monthly average.
How should I price HVAC maintenance agreements?
Price from the loaded cost of the visits plus your target margin — commonly $180 to $360 a year for two visits on one system — and treat the pull-through repair work as a bonus, not a subsidy.
Run a different trade?
Questions people ask
What is a good average ticket for residential HVAC?
It varies widely by market and service mix, so the trend matters more than the number. A ticket that has not moved in two years while parts costs rose is a pricing problem.
How many KPIs is too many?
If you cannot recite them from memory, there are too many. Six is a workable ceiling for an owner-operated company.
Where do these numbers come from?
Accounting data for margin and cash, your field service software for ticket, close rate and agreements. They have to be reconciled to the books or the KPIs drift from reality.
What does this cost?
One flat monthly price. No hourly bills, no surprises. Founding plans start at $149 a month, and your rate stays locked.
Keep reading
What is a good profit margin for an HVAC business?
Aim for 45% to 55% gross margin on service, 30% to 40% on installs, and 8% to 12% net profit for the whole company.
How does job costing work for an HVAC company?
Job costing tags every labor hour, part and subcontractor cost to a specific job so you can see the gross profit of that job instead of a monthly average.
What goes in an HVAC business plan?
An HVAC business plan needs a market and service mix, a staffing and truck plan, and a financial plan with seasonal revenue, loaded labor cost, break-even and a cash forecast.
HVAC CFO services
What we do for hvac owners every month.
HVAC bookkeeping hub
How we set the books up for your trade.
All answers
Every question we have written a straight answer to.
Pricing
Flat monthly plans based on your revenue.
Want your books handled for you?
We read your receipts, match your bank activity, and close your books every month. You get one short list of questions and a dashboard that always tells the truth.